GPS Controller for mixed ICE and EV fleet total cost of ownership dashboard 2026
GPS Controller for mixed ICE and EV fleet total cost of ownership dashboard 2026
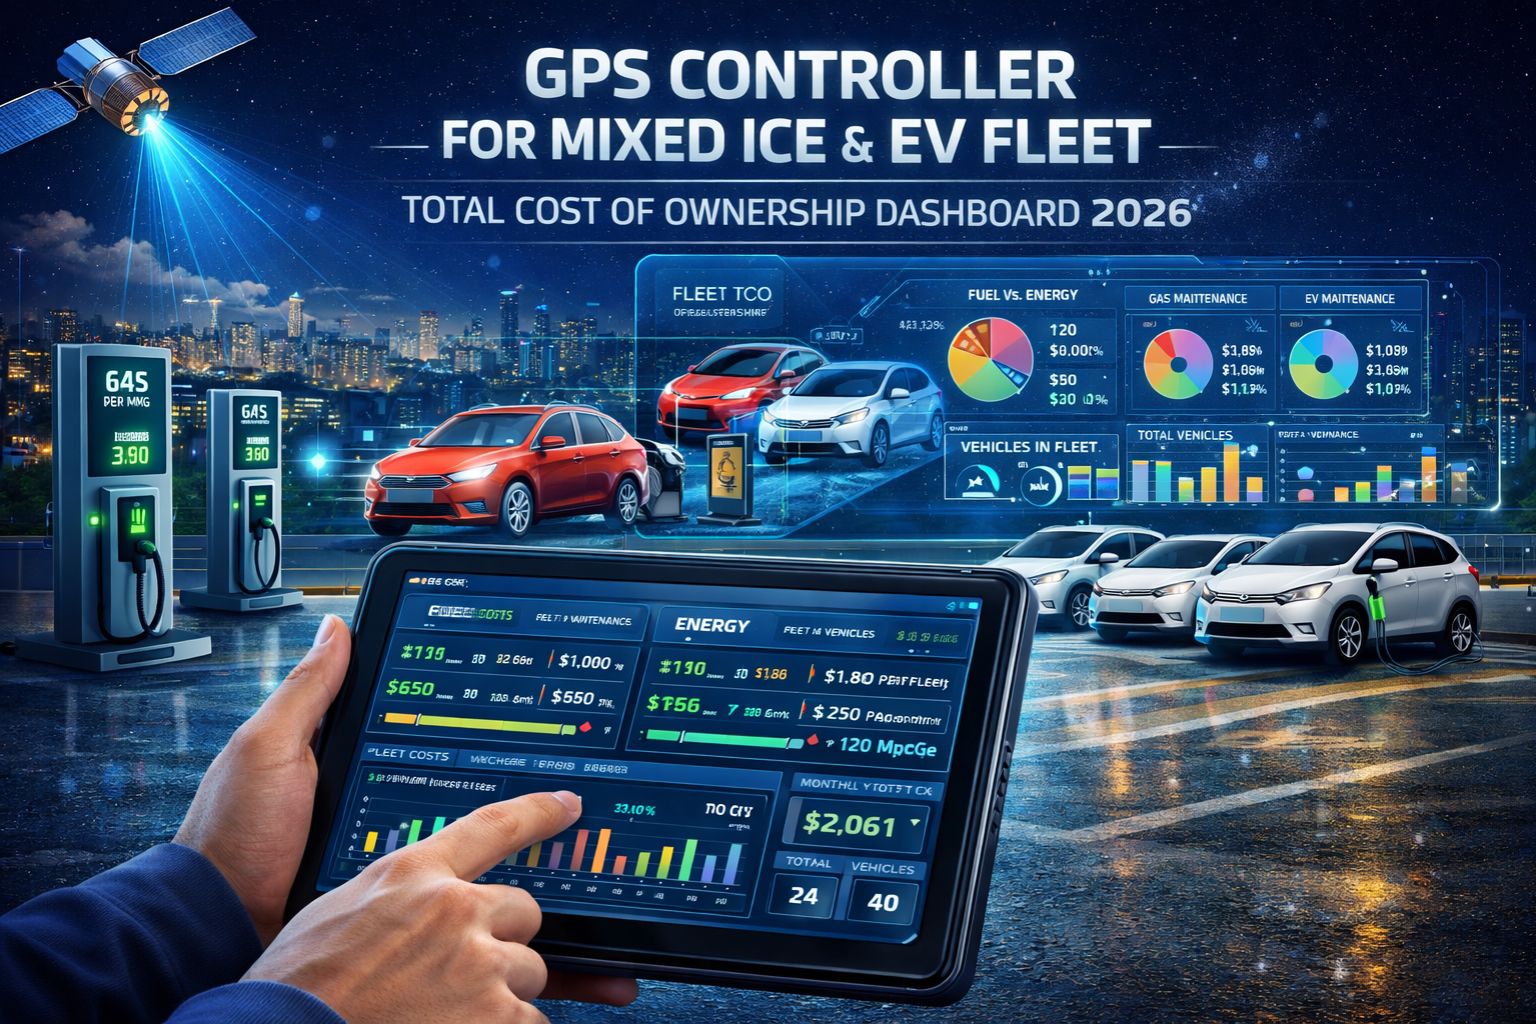
Managing a mixed fleet of internal combustion and electric vehicles usually means your total cost of ownership (TCO) data is fractured. It's stuck across fuel cards, different charging networks, and various maintenance logs, which creates a real blind spot. That makes planning for 2026 feel like a guess. A unified TCO dashboard, built for a modern fleet management platform, can pull those disparate data streams into a single view to show the real cost per mile for each type of vehicle. But here's the catch: it only works if your telematics can accurately track energy consumption and idle time across completely different powertrains. That's a big 'if'.
What a Unified TCO Dashboard Actually Shows You
The clarity comes from seeing energy cost per kilowatt-hour right next to diesel cost per gallon on the same chart, all normalized to cost per mile. In practice, this surfaces truths you might miss. For example, an EV's lower "fuel" cost might be offset by higher tire wear from all that instant torque. Or, an ICE truck's apparent efficiency can be completely destroyed by unlogged idling during mandatory rest periods. The real value of the dashboard isn't just the numbers—it's the direct, unavoidable comparison it forces between asset types. It highlights which vehicles are genuinely cheaper to operate when you look at the whole picture.
The Reality of Blended Fleet Data at Scale
When you operate at scale, data mismatches create silent errors that throw everything off. A common failure point is the charging session log. If the telematics device on an EV loses cellular signal during an overnight charge, the dashboard might show zero energy cost for that day. That artificially deflates the EV's TCO. On the flip side, an ICE vehicle's fuel transaction could be logged with a 24-hour delay from the card provider, which misaligns the fuel cost with the day's actual route and mileage. These aren't simple software bugs you can just patch. They're inherent data latency issues in blended environments, and they make year-over-year TCO trend analysis feel unreliable.
The Mistake of Averaging Costs Across Powertrains
Perhaps the most damaging assumption is creating a single "average cost per mile" for the entire mixed fleet. That average becomes a meaningless number that hides the severe underperformance of specific assets. For instance, if you average a cheap-to-run EV sedan with a poorly maintained ICE box truck, you'll get a moderate-looking TCO. But that completely masks the fact that the box truck is a massive financial drain. The critical risk here is making 2026 procurement decisions based on that blended data. You could end up ordering more of the wrong vehicle type and lock in high costs for the next decade.
When to Tune, Reconfigure, or Replace Your Tracking Foundation
The decision boundary is pretty clear, honestly. If your current system can't reliably capture and timestamp EV state-of-charge data and ICE fuel transactions in near-real-time, you're essentially tuning in the dark. You can spend time reconfiguring reports or building manual spreadsheets, but the core data integrity is missing. The moment you need accurate TCO to justify the capital expenditure for new EVs, or to comply with sustainability reporting, a foundational replacement of your telematics and software platform becomes necessary. This is where a purpose-built system like GPS Controller shifts from being just a tracking tool to a strategic asset.
FAQ
Question: What is the biggest data gap in a mixed fleet TCO dashboard?
Answer: It's the consistent attribution of "energy" cost. EVs pull from utility bills and fragmented charging networks, while ICE uses fuel cards. Without a unified data ingestion layer that normalizes these into cost per mile, you're just comparing incomplete datasets. The comparison is flawed from the start.
Question: Can delayed GPS data affect TCO calculations?
Answer: Absolutely. If location pings are delayed, your route mileage is inaccurate. That throws off both fuel/energy consumption per mile and vehicle utilization rates. It means your core efficiency metric—cost per mile—is fundamentally wrong.
Question: How do maintenance costs differ in a TCO dashboard for ICE vs. EV?
Answer: The dashboard has to separate them. EV maintenance is less frequent, but when something goes wrong, it can be far more expensive per incident (think battery diagnostics). ICE costs are more regular—oil changes, filters, that kind of thing. Blending them together hides the different cash flow and downtime patterns, which is critical for actual financial planning.
Answer: You've hit the limit when your blended TCO number no longer helps you decide which vehicle type to buy next, or when you can't explain cost variances to the finance team. At that point, you need a platform that treats ICE and EV data as first-class, distinct entities to get a true apples-to-apples comparison. That's the foundational approach of a specialized system like GPS Controller.


Comments
Post a Comment